 Written by
  Edited by
  Edited by
Investors, whether beginner or seasoned professionals, all have a threshold for risk. Some prefer to play it safe and favor a low-risk investment plan while others are more advantageous with a “high risk, high return” mindset. No matter where you find yourself on this scale, understanding how to gauge a stock and portfolio’s level of sensitivity to market fluctuations is a beneficial skill to have. The determining basis used by investors to gauge an investment’s risk and sensitivity is Beta (𝛃). This article will assist you in understanding the importance of beta as well as the two best ways to perform the calculation for a portfolio.
For assistance with key metrics like beta, a financial advisor could help you identify good investments for your portfolio.
What Is Beta?
Beta is a key metric used to identify an individual stock or portfolio’s level of volatility against the market standard. Those looking to minimize risk in their investment portfolio will want to pay close attention to their beta metric and keep it as close to the market benchmark as possible.
Why Is Beta Important?
Beta is the risk-reward measurement that informs investors how sensitive their portfolios are to market changes. The market benchmark index sits at a 1.0, and for the lowest possible volatility in a portfolio, investors need to try to remain as close to a 1.0 as possible. Here are the rules for comparing a portfolio to the index:
Anything over 1.0 indicates a higher sensitivity to market volatility. For example, a portfolio with a beta3 greater than 1.0 is prone to being more unstable and may go up or down more than the market goes up or down. Anything under 1.0 indicates a less sensitive reaction to market volatility. For example, a portfolio with a beta less than 1.0 will typically perform close to market performance.
Note: While negative betas are not unheard of they are uncommon and suggest that the portfolio will react the opposite of the market.
Portfolio Beta vs. Stock Beta: What’s the Difference?
Portfolio beta is the measure of an entire portfolio’s sensitivity to market changes while stock beta is just a snapshot of an individual stock’s volatility. Since a portfolio is a collection of multiple stock holdings the formulas used to calculate the beta for each will look different.
An investor looking to minimize risk and maximize overall return and value will want to understand how to use both formulas. This is helpful when analyzing diversification and making informed decisions on which investments will hurt or help your portfolio performance.
First, let’s get familiar with the beta formulas for both a stock and a portfolio and then see how an investor would complete the calculations for each. Both manually and using the Microsoft Excel program.
Portfolio beta formula
The formula for portfolio beta takes the beta of each stock, asset, or holding and averages the weights together.
𝛃ₚ = beta of the portfolio
𝛃= beta of the holding
W = the weight of the holding (how much of that holding you have in comparison to the rest of your portfolio)
𝛃ₚ = W₁𝛃₁+W₂𝛃₂+W₃𝛃₃…..W₉𝛃₉
Stock beta formula
The formula for the beta of an individual stock within a portfolio takes the covariance divided by the variance. Investors can also find the correlation between the market index standard, multiply it by the stock’s standard deviation and divide it by the market index’s standard deviation.
𝛃 = Covariance/Variance
𝛃 = Cov (rᵢ,rₘ) / Var(rₘ)
Covariance is the measure of a stock’s return as it relates to the market
Variance is the measure of the market’s return as it relates to the mean
rᵢ = expected return of the stock
rₘ = average expected return of the market
𝛃ₛ = (ρ) (σₛ/σₘ)
𝛃ₛ = beta of the stock
(ρ) = correlation coefficient
σₛ = stock standard deviation
σₘ = market standard deviation
How to Manually Calculate Beta for a Portfolio, and an Example
Calculating beta by hand is not the most efficient way to get the answers you need regarding portfolio volatility. Especially if you hold a substantial amount of assets within a portfolio. While we don’t expect you to be a math pro, we encourage you to have at least a high-level command of the calculations.
Having an understanding of how to get the answers on your own without integrating the help of a program gives you a comprehension of the formula and what each step contributes to the outcome. Let’s say you were trying to find the beta of a small portfolio with five stocks (Apple, Microsoft, 3M, Tesla and Netflix). Here are the steps you need to take:
Step 1: Find Your Stock(s) Value
To find your stock’s value take the price of the stock and multiply it by the number of shares you own. Do this for each stock in your portfolio.
Stockₐ value = Price of Stockₐ (x) No. of shares
| Stock | Price | No. of Shares | Stock Value |
| Apple | $213 | 10 | $2,130 |
| Microsoft | $498 | 10 | $4,980 |
| 3M | $152 | 10 | $1,520 |
| Tesla | $315 | 10 | $3,150 |
| Netflix | $1,297 | 10 | $12,970 |
Step 2: Determine Each Stock’s Weight
To determine the weight of your stock, calculate the total amount of each stock and what percentage it is of the overall portfolio and multiply by 100 to convert it to a percentage.
Stockₐ weight = (Total number of Stockₐ / Total stock in the portfolio) x 100

Step 3: Find the Weighted Beta
Determining the weighted beta is where you will take the stock’s weighted percentage you found in step 2 and multiply it by the stock beta.
Beta weight = Stockₐ weight (x) Stockₐ beta
For the in-depth rundown of how to find a stock’s individual beta, our guide “What Is Beta?” will break down each step.
| Stock | Stock Weight | Stock Beta | Beta Weight |
| Apple | 20% | 1.29 | 0.258 |
| Microsoft | 20% | 1.19 | 0.238 |
| 3M | 20% | 0.79 | 0.158 |
| Tesla | 20% | 2.04 | 0.408 |
| Netflix | 20% | 1.3 | 0.26 |
Step 4: Put It All Together
Once you find the weighted beta figures all that is left is to sum them together for the overall portfolio beta.
𝛃ₚ = W₁𝛃₁+W₂𝛃₂+W₃𝛃₃…..W₉𝛃₉
𝛃ₚ = ..258 + .238 + .158 + .408 + .260
𝛃ₚ = 1.32
Since the total beta for the portfolio is more than 1.0 (1.32) we can assume that this portfolio is more susceptible to volatility and may not track the index as closely as a profitable investment portfolio with a lower beta.
How to Calculate Beta for a Portfolio With Excel or Sheets
As we stated earlier, performing the beta calculation by hand can be arduous, plus it opens you up to errors and miscalculations. Using programs like Microsoft Excel or Google Sheets to automate the formula will save you time (after the format is set up) and provide peace of mind regarding the accuracy of your asset allocation calculations. For this example, we used Google Sheets but the formulas perform the same for Excel as well.
Step 1: Enter Your Data and Format
Organized and formatted data is the most efficient way to keep your information usable and beneficial for your valuations. By failing to keep your data up to date and organized you’re essentially putting yourself in a position to do more unnecessary work.
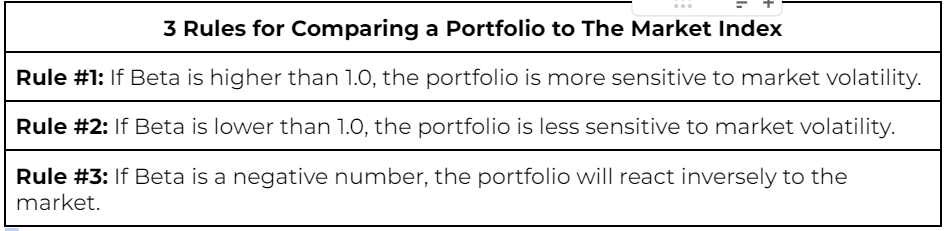
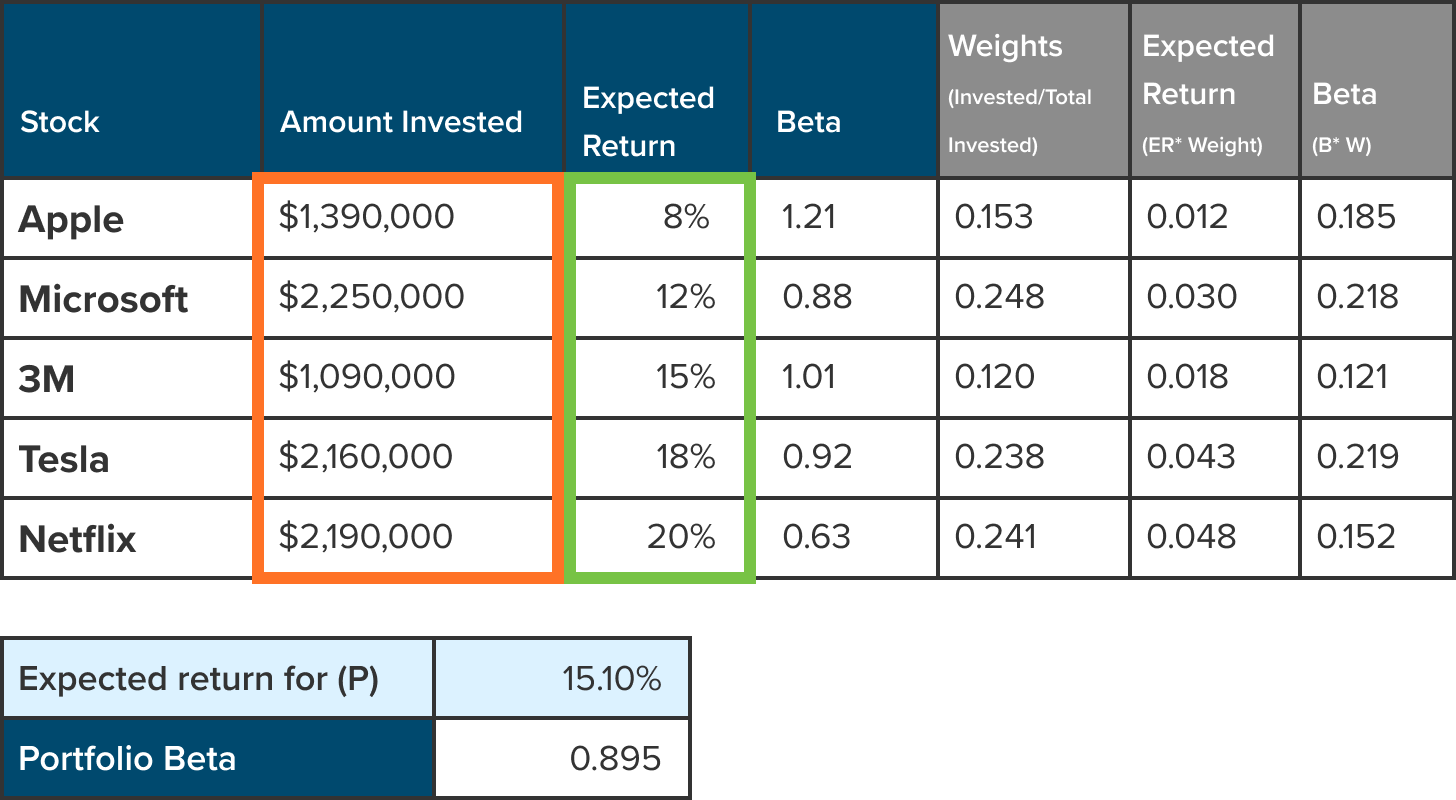
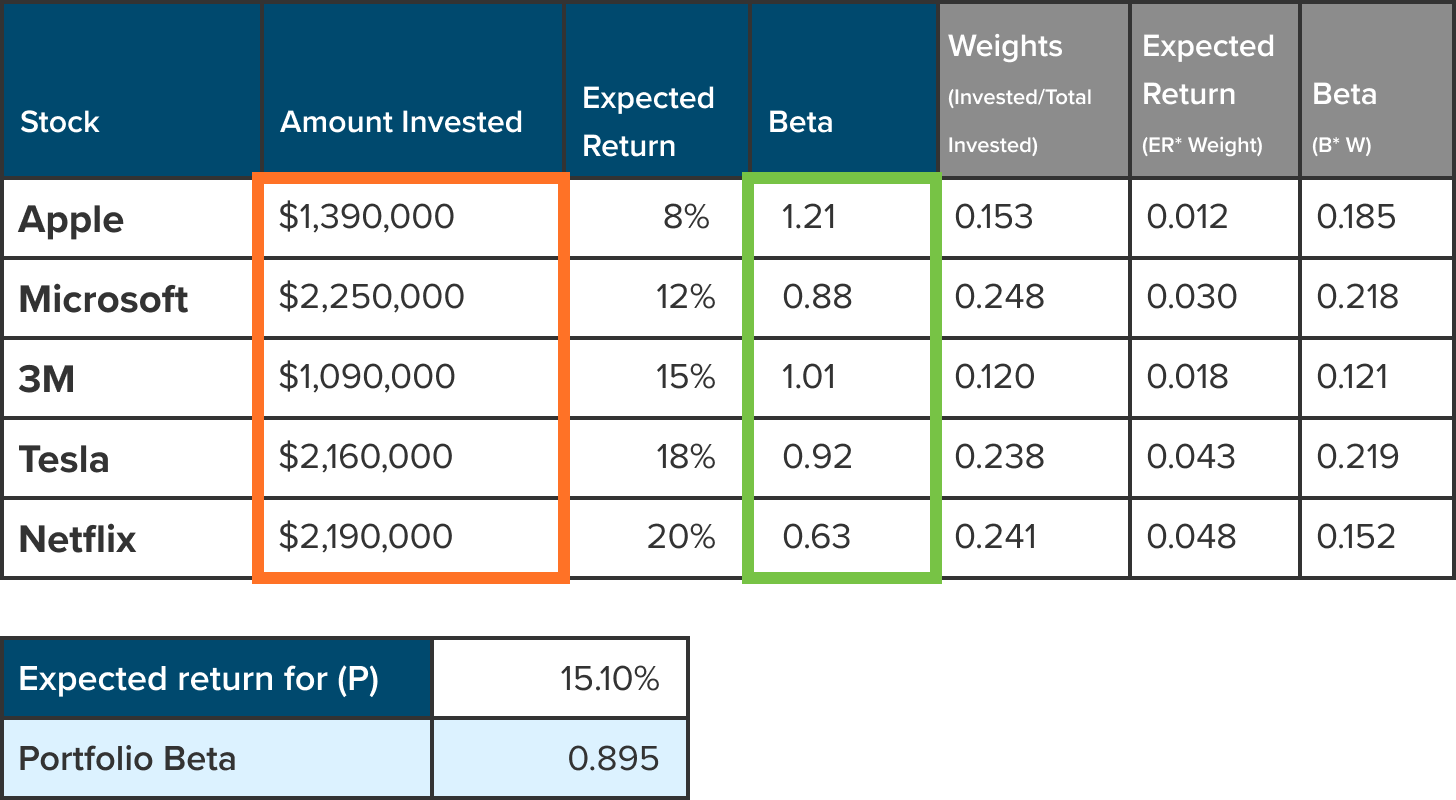
Referring to the visual below we want to include these elements in our datasheet.
- A named file: Always name your file where it’s easy to locate and can be differentiated from other similar files.
- Autosave enabled: With large data sets it can take time to enter all the information and format it to your liking. Don’t risk the sudden loss of your work by failing to enable autosave.
- Aesthetic formatting: Create separation and organization by integrating different colors, bolding, and borders.
- Numerical formatting: Check the formatting for your numbers to ensure that your data is being recorded correctly. For instance, if you type in 15% and then hit the “%” formatting it can shift your 15% to 1500%.
| Stock | Amount Invested | Expected Return | Beta | Weights (Invested/Total Invested) | Expected Return (ER* Weight) | Beta (B* W) |
| Apple | $1,390,000 | 8% | 1.29 | 0.153 | 0.012 | 0.197 |
| Microsoft | $2,250,000 | 12% | 1.10 | 0.248 | 0.030 | 0.295 |
| 3M | $1,090,000 | 15% | 0.79 | 0.120 | 0.018 | 0.094 |
| Tesla | $2,160,000 | 18% | 2.04 | 0.238 | 0.043 | 0.485 |
| Netflix | $2,190,000 | 20% | 1.3 | 0.048 | 0.048 | 0.313 |
| Expected return for (P) | 15.10% |
| Portfolio Beta | 1.386 |
Step 2: Calculate the Weights
Weights (highlighted in column “E” shown below) are captured by dividing the amount invested by the total investment. The formula is:
Weight = Amount invested / Total Invested
Which translates to:
Weight = B5/SUM($B$5 : $B$9)
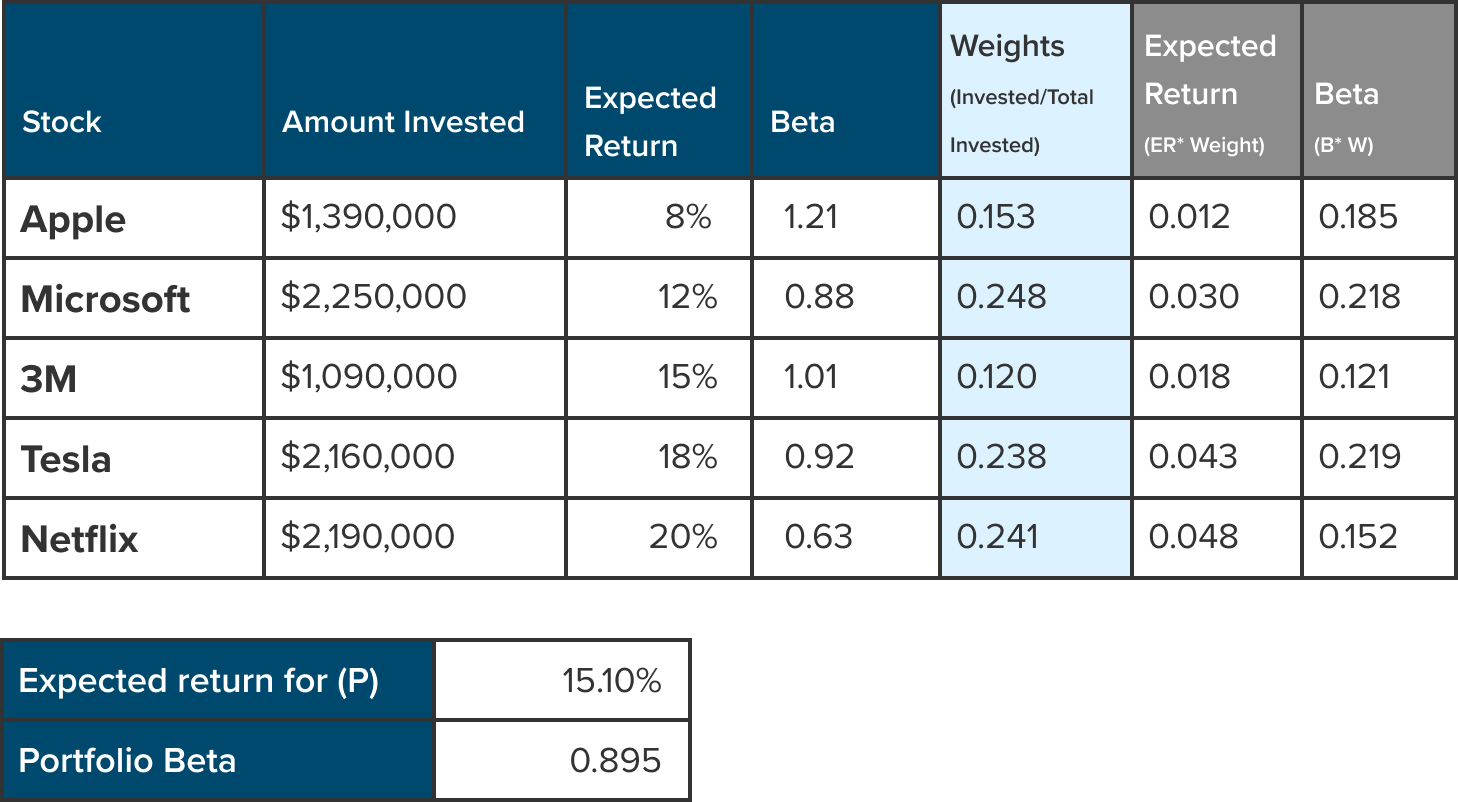
Step 3: Calculate the Expected Return for (P)
The expected return for (P) is calculated by multiplying the expected return for the stock by the weights we calculated in step 2.
Expected return for (P) = expected return x weight
Which translates to:
ER(p) = C5*E5
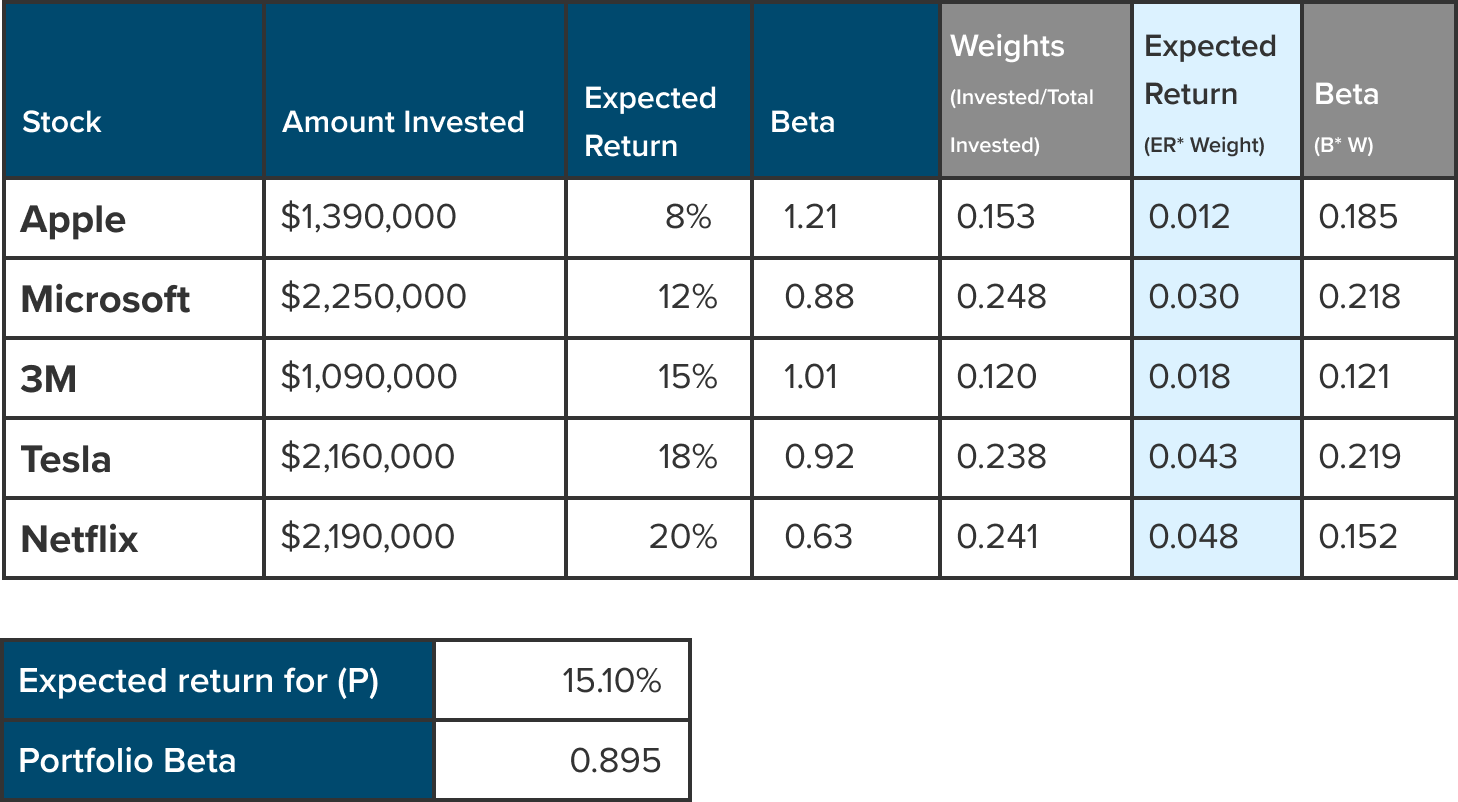
Step 4: Calculate the Beta
Beta (highlighted in column “G” shown below) is captured by multiplying the beta of the stock by the weight. The formula is:
Beta = Stock beta * weight
Which translates to:
Beta = D5 * E5
Step 5: Shortcuts for Expected Return for (P) and Portfolio Beta
The beauty of programs like Excel and Sheets is that there are functions to shortcut most of the calculations.
- Expected return (P): Highlighted in row 11 (shown below) the expected return for the portfolio as a whole is performed by using the SUMPRODUCT function.
=(SUMPRODUCT( amount invested / sum (amount invested), expected return) =(SUMPRODUCT(B5:B9/SUM(B5:B9),C5:C9)
2. Total portfolio beta: Highlighted in row 12 (shown below) is the total portfolio beta is performed also by using the SUMPRODUCT function. Total portfolio beta: Highlighted in row 12 (shown below) is the total portfolio beta is performed also by using the SUMPRODUCT function.
=(SUMPRODUCT( amount invested / sum (amount invested), stock beta) =(SUMPRODUCT(B5:B9/SUM(B5:B9),D5:D9)
Troubleshooting Tips for Beta Calculations
While the use of beta is extremely beneficial, there are ways to ruin your valuations if you’re not careful. As an investor, especially if you’re a beginner investor, you need to know how to perform the correct calculations, while simultaneously being keen on identifying false calculations. These are the ones that can vastly skew your results and render your data useless, making it more difficult to decide on the right types of investment for your portfolio.
Tip 1: Be wary of “current” Beta
Beta as a metric is not foolproof; it is an estimate based on past data. Historical data can give you an idea of returns but doesn’t account for the present time. Meaning past data won’t encompass new information and will only continue to change over time. The best case to mitigate risks is by running valuations using multiple betas (high, low and average).
Tip 2: Rein in your ranges
Of these three ranges you use, keep them tight. The more you deviate and loosen the ranges the bigger an extreme you risk getting when building your risk profile. To be safe your ranges should mimic the high, low, and average betas from the previous years ranging from 1 to 10 years.
Tip 3: Don’t over-manipulate the data
Avoiding high risk and seeing a high return is a balancing act of diversification and accurate valuation. While it may be tempting to go outside of your ranges to skew the outcome, resist the urge to over-manipulate the data. Keep your betas, market return and risk-free rates within a set range.
How to Interpret Beta in the Context of Your Investment Goals
Calculating beta is only half the equation—understanding what it means for your portfolio and financial goals is what gives the metric real value. Beta helps you assess how much market-related risk you’re taking on, but how you apply it depends on your investment strategy and time horizon.
A beta of 1.0 means your portfolio moves in line with the broader market. If the market rises or falls by 5%, your portfolio is expected to do the same. This is typically a benchmark for portfolios that aim to track market performance without excessive volatility.
A beta below 1.0 (e.g., 0.8) suggests lower sensitivity to market movements. For a retiree or a conservative investor focused on capital preservation, this may be ideal. While you may not see rapid gains in a bull market, your portfolio is less likely to experience steep losses in a downturn.
A beta above 1.0 (e.g., 1.2) signals greater volatility than the market. For a younger or growth-focused investor, this could be appropriate—especially if you have time to ride out short-term swings in pursuit of higher long-term returns.
When setting your asset allocation, beta can guide how much risk you’re taking relative to your goals. For instance, allocating more to low-beta sectors (like utilities or consumer staples) can help stabilize a portfolio, while high-beta assets (like tech stocks) may amplify returns—and risks.
Ultimately, using beta as a risk gauge allows you to align your portfolio with your comfort level, financial goals, and investment timeline.
Bottom Line
Beta has been proven to be an asset to investors looking to stave off unnecessary volatility and risk within their portfolio holdings. Some even argue that the beta metric holds more weight than stock value or growth. However, this metric is not without flaws. Using beta without including present-day market accountability can yield wildly inaccurate results. Also manipulating your beta too far left or right can skew data to either extreme. By implementing conservative ranges and sticking to them, investors can mitigate flaws in their valuations.
Tips on Making Better Investment Decisions
- Measuring your risk tolerance and building your portfolio can be difficult tasks. So we created an asset-allocation calculator to help you. It gives you some examples of what appropriate asset mixes may be based on your risk tolerance.
- Whether you’re a beginner or building your investing acumen, you can learn from the best books for investors.
- Understanding beta and everything else involved with picking the right stocks can be a difficult process. This is why the guidance of a financial advisor can come in handy when making investing decisions. Finding a financial advisor doesn’t have to be hard. SmartAsset’s free tool matches you with up to three vetted financial advisors who serve your area, and you can have a free introductory call with your advisor matches to decide which one you feel is right for you. If you’re ready to find an advisor who can help you achieve your financial goals, get started now.