 Written by
  Reviewed by
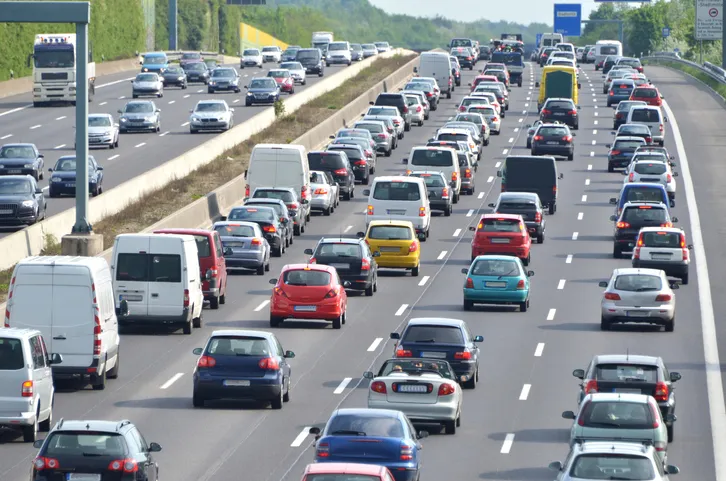
Car ownership consumes a major share of many household budgets. Between loan payments, maintenance, fuel and auto insurance, the cost of owning and operating a vehicle now averages more than $11,000 per year. Even as U.S. cities and counties increase investment in public transportation, more than 90% of American households own or lease at least one vehicle.
SmartAsset set out to determine which states are best for drivers, and where car ownership is most challenging. The analysis examined four metrics in each state: traffic fatalities per 100 million miles driven, the share of interstate highways in good condition, gasoline costs relative to median household income and auto insurance costs relative to median household income. The metrics were combined into a composite score used to rank each state.
Key Findings
- Massachusetts ranked as the best state for drivers. While Boston may be known for difficult parking and heavy congestion, Massachusetts ranked No. 1 overall in the analysis.
- The state that pioneered the modern freeway system is one of the worst for drivers. California helped pioneer modern freeway design with the opening of the Arroyo Seco Parkway in 1940, but high gasoline and auto insurance costs and below-average highway quality pushed the state into the bottom quartile at No. 39.
- Gasoline costs look different when adjusted for income. Regular gas is most expensive by pump price in California, Hawaii and Washington, where it averages more than $5 per gallon. But relative to median household income, gasoline costs are highest in Mississippi, Nevada and West Virginia.
- Rhode Island has the lowest traffic fatality rate. Rhode Island had the lowest traffic fatality rate in the study, at 0.5 deaths per 100 million vehicle miles traveled. West Virginia had the highest rate, at 1.6 deaths per 100 million vehicle miles traveled.
10 Best States for Drivers
1. Massachusetts
• Insurance premium, as percentage of median annual household income*: 1.28%
• Price of a tank of gas, as percentage of median weekly household income: 3.08%
• Auto fatalities per 100 million miles traveled: 0.6
• Interstate highways in good condition: 69%
2. Minnesota
• Insurance premium, as percentage of median annual household income*: 1.33%
• Price of a tank of gas, as percentage of median weekly household income: 3.46%
• Auto fatalities per 100 million miles traveled: 0.6
• Interstate highways in good condition: 71%
3. New Jersey
• Insurance premium, as percentage of median annual household income*: 1.54%
• Price of a tank of gas, as percentage of median weekly household income: 3.08%
• Auto fatalities per 100 million miles traveled: 0.7
• Interstate highways in good condition: 70%
3. North Dakota
• Insurance premium, as percentage of median annual household income*: 1.17%
• Price of a tank of gas, as percentage of median weekly household income: 3.77%
• Auto fatalities per 100 million miles traveled: 0.8
• Interstate highways in good condition: 81%
5. Utah
• Insurance premium, as percentage of median annual household income*: 1.26%
• Price of a tank of gas, as percentage of median weekly household income: 3.47%
• Auto fatalities per 100 million miles traveled: 0.7
• Interstate highways in good condition: 67%
6. Connecticut
• Insurance premium, as percentage of median annual household income*: 1.49%
• Price of a tank of gas, as percentage of median weekly household income: 3.44%
• Auto fatalities per 100 million miles traveled: 0.7
• Interstate highways in good condition: 73%
7. New Hampshire
• Insurance premium, as percentage of median annual household income*: 0.98%
• Price of a tank of gas, as percentage of median weekly household income: 3.22%
• Auto fatalities per 100 million miles traveled: 0.9
• Interstate highways in good condition: 60%
8. Wisconsin
• Insurance premium, as percentage of median annual household income*: 1.22%
• Price of a tank of gas, as percentage of median weekly household income: 3.88%
• Auto fatalities per 100 million miles traveled: 0.8
• Interstate highways in good condition: 71%
9. Indiana
• Insurance premium, as percentage of median annual household income*: 1.36%
• Price of a tank of gas, as percentage of median weekly household income: 3.69%
• Auto fatalities per 100 million miles traveled: 0.9
• Interstate highways in good condition: 71%
9. South Dakota
• Insurance premium, as percentage of median annual household income*: 1.43%
• Price of a tank of gas, as percentage of median weekly household income: 3.96%
• Auto fatalities per 100 million miles traveled: 1
• Interstate highways in good condition: 84%
10 Worst States for Drivers
1. Louisiana
• Insurance premium, as percentage of median annual household income*: 3.08%
• Price of a tank of gas, as percentage of median weekly household income: 4.62%
• Auto fatalities per 100 million miles traveled: 1.3
• Interstate highways in good condition: 22%
2. Mississippi
• Insurance premium, as percentage of median annual household income*: 2.24%
• Price of a tank of gas, as percentage of median weekly household income: 4.79%
• Auto fatalities per 100 million miles traveled: 1.4
• Interstate highways in good condition: 57%
3. West Virginia
• Insurance premium, as percentage of median annual household income*: 1.91%
• Price of a tank of gas, as percentage of median weekly household income: 5.19%
• Auto fatalities per 100 million miles traveled: 1.6
• Interstate highways in good condition: 78%
3. Hawaii
• Insurance premium, as percentage of median annual household income*: 0.94%
• Price of a tank of gas, as percentage of median weekly household income: 4.14%
• Auto fatalities per 100 million miles traveled: 1.3
• Interstate highways in good condition: 15%
5. Montana
• Insurance premium, as percentage of median annual household income*: 1.49%
• Price of a tank of gas, as percentage of median weekly household income: 4.31%
• Auto fatalities per 100 million miles traveled: 1.4
• Interstate highways in good condition: 40%
6. Oregon
• Insurance premium, as percentage of median annual household income*: 1.41%
• Price of a tank of gas, as percentage of median weekly household income: 4.50%
• Auto fatalities per 100 million miles traveled: 1.2
• Interstate highways in good condition: 40%
6. Arizona
• Insurance premium, as percentage of median annual household income*: 1.75%
• Price of a tank of gas, as percentage of median weekly household income: 4.21%
• Auto fatalities per 100 million miles traveled: 1.4
• Interstate highways in good condition: 51%
8. Maine
• Insurance premium, as percentage of median annual household income*: 1.15%
• Price of a tank of gas, as percentage of median weekly household income: 4.19%
• Auto fatalities per 100 million miles traveled: 1.1
• Interstate highways in good condition: 21%
9. New Mexico
• Insurance premium, as percentage of median annual household income*: 1.82%
• Price of a tank of gas, as percentage of median weekly household income: 4.43%
• Auto fatalities per 100 million miles traveled: 1.4
• Interstate highways in good condition: 61%
10. Arkansas
• Insurance premium, as percentage of median annual household income*: 1.98%
• Price of a tank of gas, as percentage of median weekly household income: 4.63%
• Auto fatalities per 100 million miles traveled: 1.3
• Interstate highways in good condition: 69%
* Insurance affordability reflects the latest available state-level per-vehicle premiums relative to estimated 2026 median household income. Results are comparative estimates, not current premium-to-income ratios.
Methodology
Four variables were selected to evaluate each state: average retail gasoline price from AAA as of June 3, 2026; average per-vehicle auto insurance premium from the National Association of Insurance Commissioners’ 2022/2023 Auto Insurance Database Report, published in December 2025; the share of interstate highway pavement rated good in the most recent year available from the Federal Highway Administration’s Highway Performance Monitoring System; and the traffic fatality rate per 100 million vehicle miles traveled from the National Highway Traffic Safety Administration’s early estimate for the first half of 2025. Insurance premiums were adjusted relative to each state’s median household income. Estimated current median household income was calculated by adjusting each state’s 2024 median household income from the U.S. Census Bureau’s American Community Survey 1-year estimates using growth in the Employment Cost Index for private-industry wages and salaries from the 2024 annual average through the first quarter of 2026. Gasoline costs are presented as the estimated price of a 15-gallon tank. Annual median household income was divided by 52 to express gasoline costs as a share of weekly household income. Because comparable state-level insurance data are released with a lag, insurance affordability reflects the latest available premiums relative to estimated 2026 income. Results should be interpreted as comparative estimates rather than current premium-to-income ratios. Each state’s values were normalized and combined into a composite index using weighted aggregation. Source data providers are not affiliated with, and do not endorse or sponsor, this study or its findings.
Photo credit: ©iStock.com/XXLPhoto